Background
A potentiostat is a device capable of producing IV curve measurements that shows hysteresis effects due to various chemical reactions, the potentiostat does this by keeping the applied potential at the conter electrode at a fixed level in relation to the reference electrode during the measuring of the outgoing electrical current in the working electrode. The conter electrode is can be made of platinum, while the reference electrode is more advanced in its construction, and are usually bought as is, this to certify that several different measurements can be compared to a known electrode. The working electrode is the one you want to measure.
The idea for building this potentiostat is the need for measurements on fabricated capacitors and electrodes. For the electrodes this device could be used to caracterize the electrode functionality in an electrochemical cell and for the capacitors, electrical characterization can be made and especially the AC-dependency is an important property to measure.
Currently we don not posses the proper instrumentation for this.
Method
The idea is to use the National Instruments PXI measurement system with some simple electric circuitry to be able to make cyclic voltammetry system. We are also interested in conducting AC-dependent measurement such as Nyquist plots.
I read the book by Allen J. Bard, Electrochemical methods, Wiley, from the year 1980 it contained some basic electronic circuitry drawings for building a potentiostat.
The device is made around a simple circuit with just a few operational amplifiers. Building a bipotentiostat is no more thing than adding one more amplifier, so I decided to do that as well. The bipotentiostat is used when you use a rotating ring disk electrode, at the moment this is not something we directly need, but perhaps in a near future. The connector block SCB-68 of the PXI system features 5V power supply, to drive the amplifiers I choose to include a DCP020515D, switching voltage IC that supplies ±15V out of 5V. As regarding the operational amplifiers I used CA3140E standard MOSFET amplifier, mainly because I have some left overs from earlier experiments.


Figure 1, (left) electrical drawing of the components used, color coding matches the photo (right) of the SCB-68 connector block with the operational amplifiers (four small IC) and the switching IC (the big one).
Results
For the reference electrode I found a Ag/AgCl type in the lab. The conter electrode is made up of wiring a 0.25 mm platinum wire around a glass rod. The working electrode is a DSA-electrode prototype, I will not write anymore onto this as the topic is just to verify the operational status of the built potentiostat. Se figur 2, for the experimental setup.


Figur 2, (left) the setup of the electrochemical cell, and a detailed photo (right), the black square electrode in the front beaker is the working electrode, the conter electrode is the platinum wire on the glass rod and, the reference Ag/AgCl electrode is seen in the other beaker at the back thats in turn is connected to the cell by the bent pipet.
The LabView software code is is an algoritm that sends out a ramp up and down signal for the voltage sweep while taking measurements of the current from the working electrode. As can be seen in the screen dump most basic functions of cyclic voltammetry can be controlled, i.e sweep rate, scan limits, number of cycles etc.

Figure 3, screen dump of the LabView program in operation.
The plot below shows the basic cyclic voltammetry result. The curve is partly what one can expect from this DSA electrode, the curve shows some basic hysteresis effects, however it also contains unknown peaks around the intervall 0.35V-0.40V which I at the moment do not know the meaning of. The noise that can be seen around the curve is also of strange origin and seems partly periodic, and repetitively and in coherence for each cycle sweep.

Figure 4, The cyclic voltammetry plot of the test run.
The AC measurement method, I have at this moment just tried out very momentarily. The first goal is to produce a Nyquist plot of a simple electronic setup of a resistor in series with a capacitor and a resistor, se figure 5.
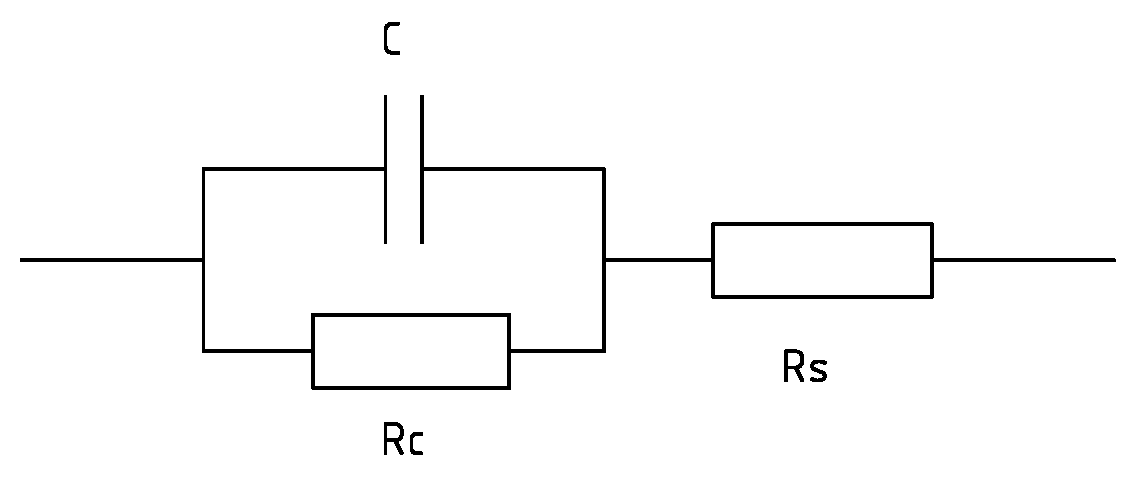

Figur 5, (top) the simple electrical setup for the Nyquist measurements. (bottom) the corresponding Nyquist plot, the offset of the half cirlce from the vertical axis is related to the series resistance, while the diameter of the half circle corresponds to the capacitors parallell resistance, the height of the circle is linked to the capacitance.
I conducted this test by introducing white noise into the setup and thereafter Fourier transform the measured result to produce the Nyquist plot, as seen in figure 5. This approach is easier and quicker than the regular sweeping of the frequency method, especially if you can do it in software.
The produced Nyquist plot shows the right shape for the electrical setup being tested but unfortunately it is not correct to the values and at least 30% error can be observed. Later I will try the more basic frequency sweeping method instead.
This homemade potentiostat seems to work partly, cause it shows some basic cyclic voltammetry results, however there still remains some unsolved question regarding peaks and noise as seen in the plots. The AC methods have not been tested yet to any larger extent.
There is now an update to this post in the home-made-cyclic-voltammetry-system, part II post.
Ten people who speak make more noise than ten thousand who are silent. See the link below for more info.
ReplyDelete#noise
www.ufgop.org
I can't help but think about where it will go. I'm thinking right in front of the big window.testingconstruction
ReplyDelete